Import the MapModel into a Component
Custom components can already interface with much of the functionality in VertiGIS Studio Web through commands and operations. However, sometimes more direct access to the data structures that power components is needed.
This article will teach you how to inject the Map model into a custom component so you can directly access the Esri Map object and add a graphics layer to it.
Prerequisites
- Download and setup the VertiGIS Studio Web SDK.
- Check out the deployment instructions to learn more about deploying custom code to a VertiGIS Studio Web App.
Create a Custom Component With a Model
First, we will create a custom component that has an associated model.
To learn more about registering and using a component in the layout, check out the component reference
- Component
- Model
- Layout
import React from "react";
import {
    LayoutElement,
    LayoutElementProperties,
} from "@vertigis/web/components";
import Button from "@vertigis/web/ui/Button";
import { CustomModel } from ".";

export default function CustomComponent(
    props: LayoutElementProperties<CustomModel>
) {
    return (
        <LayoutElement {...props}>
            <Button onClick={() => props.model.addGraphic()}>
                Add a Graphic to the Map
            </Button>
        </LayoutElement>
    );
}
import {
    ComponentModelBase,
    serializable,
} from "@vertigis/web/models";

@serializable
export default class CustomModel extends ComponentModelBase {
    addGraphic() {
        throw new Error("Not yet implemented.");
    }
}
<?xml version="1.0" encoding="utf-8" ?>
<layout xmlns="https://geocortex.com/layout/v1" xmlns:custom="your.custom.namespace">
    <map>
        <custom:custom-component slot="top-center"/>
    </map>
</layout>
Inject the Map Model into the Component
Next, we can inject the Map model, which is the type MapExtension, into the component using the model injection pattern.
@serializable
export default class CustomModel extends ComponentModelBase {
    @importModel("map-extension")
    mapExtension: MapExtension | undefined;
    ...
}
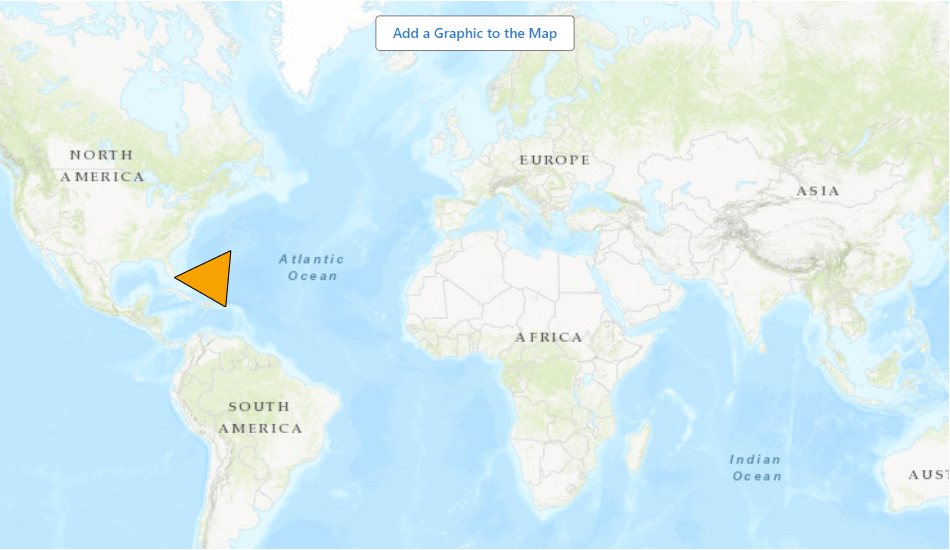
Use the Map Model to Add a New Graphics Layer
Finally, we can use the MapExtension to add a custom graphics layer to the ArcGIS Map object.
- Component
- Model
- UI
import React from "react";
import {
    LayoutElement,
    LayoutElementProperties,
} from "@vertigis/web/components";
import Button from "@vertigis/web/ui/Button";
import { CustomModel } from ".";

export default function CustomComponent(
    props: LayoutElementProperties<CustomModel>
) {
    return (
        <LayoutElement {...props}>
            <Button onClick={() => props.model.addGraphic()}>
                Add a Graphic to the Map
            </Button>
        </LayoutElement>
    );
}
import {
    ComponentModelBase,
    serializable,
    importModel,
} from "@vertigis/web/models";
import { MapExtension } from "@vertigis/arcgis-extensions/mapping/MapExtension";
import Graphic from "esri/Graphic";
import GraphicsLayer from "esri/layers/GraphicsLayer";
import { Polygon } from "esri/geometry";
import { SimpleFillSymbol } from "esri/symbols";

@serializable
export default class CustomModel extends ComponentModelBase {
    @importModel("map-extension")
    mapExtension: MapExtension | undefined;

    // based on https://developers.arcgis.com/javascript/latest/sample-code/sandbox/index.html?sample=intro-graphics
    triangleGraphic = new GraphicsLayer({
        graphics: [
            new Graphic({
                symbol: new SimpleFillSymbol({ color: "orange" }),
                geometry: new Polygon({
                    rings: [
                        [
                            [-64.78, 32.3],
                            [-66.07, 18.45],
                            [-80.21, 25.78],
                            [-64.78, 32.3],
                        ],
                    ],
                }),
            }),
        ],
    });

    addGraphic() {
        if (this.mapExtension) {
            const esriMap = this.mapExtension.map;
            esriMap.add(this.triangleGraphic);
        } else {
            console.error(
                "Could not add graphic to map, as no map model was imported into the 'CustomModel'."
            );
        }
    }
}
Live Sample
Check out a live SDK sample that demonstrates injecting the map model into a component.
Next Steps
Learn more about Component Interactions
Learn more about how components interact with each other through models and services
Learn how Components are Bound to Models in the Layout
Learn how layout structure can be used to bind components to their required models